Task History
Table of Contents
Overview
Track and review all task executions with comprehensive history and statistics. Task History provides a table panel for monitoring task execution status, timing, and results, a Statistics view for aggregated per-task metrics, and a Dashboard with interactive charts for an at-a-glance view of workspace-wide task health.
Table View
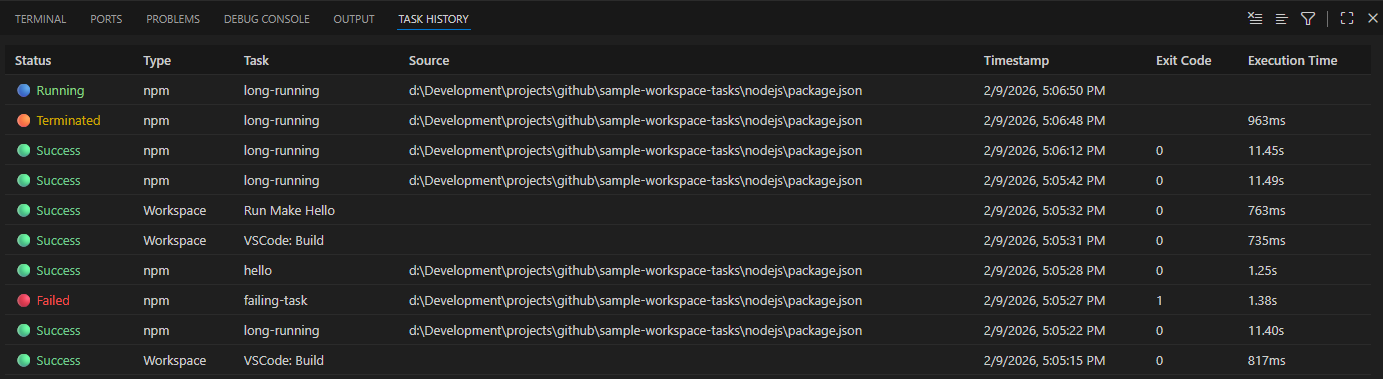
The Task History Table View provides a tabular, sortable view of all task executions with detailed information.
Features
- Status Filtering — Filter by task status (Running, Success, Failed, Terminated)
- Sortable Columns — Click any column header to sort tasks by that field
- Comprehensive Details — View status, type, task name, source path, timestamp, exit code, and execution time
- Status Indicators — Color-coded status labels/icons for quick identification:
- 🟢 Success — Task completed successfully
- 🔴 Failed — Task exited with an error
- 🔵 Running — Task is currently executing
- 🟠 Terminated — Task was stopped manually
- Metrics Hint — Each row shows the task’s average duration and a flaky-streak badge (if the task has failed 3 or more times consecutively)
- Single-column Sorting — Sort by any column in ascending or descending order, one column at a time
- Real-time Updates — Automatically updates as tasks complete
How to Use
- Open the Task History panel
- Click column headers to sort by that field (click again to reverse order)
- Review detailed execution information including exact timestamps and durations
- Use the scrollable view to review extensive task history
Statistics View
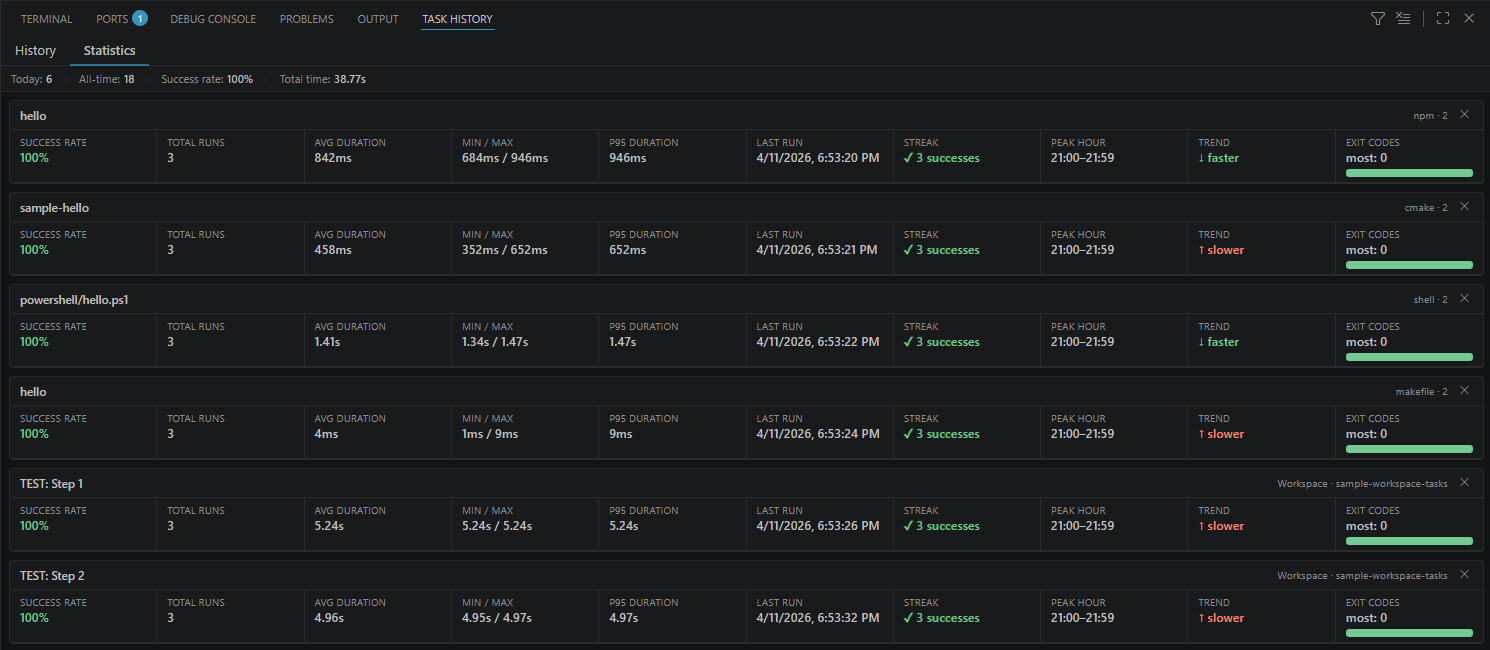
v1.7.0 Task Statistics View — aggregated per-task
The Statistics View provides aggregated per-task execution metrics, giving you a quick overview of how each task is performing over time.
Features
- Summary Bar — Shown at the top of both History and Statistics modes:
- Today — Number of tasks run since midnight (from in-memory history)
- All-time — Total task executions across all runs (from persisted metrics)
- Success rate — Overall success percentage across all tracked tasks
- Total time — Sum of all recorded execution durations
- Per-task Cards — One card per tracked task, sorted by most-run first, each showing:
- Success Rate — Color-coded: green ≥ 80%, amber ≥ 50%, red < 50%
- Total Runs — All-time execution count
- Avg / Min / Max / p95 Duration — Computed from the last N duration samples (configurable)
- Last Run — Timestamp of the most recent execution
- Streak — Consecutive failure or success count; consecutive failures ≥ 3 are highlighted in red
- Peak Hour — Hour of day (0–23) when the task runs most often
- Trend — Whether recent durations are getting slower (↑), faster (↓), or stable (→)
- Exit Codes — Proportional bar chart of all recorded exit codes with tooltips; most-common exit code shown
- Clear Metrics — Click the ✕ button on any card to clear that task’s metrics data
How to Use
- Open the Task History panel
- Click the Statistics tab to switch to the metrics view
- Review per-task cards for performance trends and failure patterns
- Click ✕ on a card to reset metrics for that task
- To clear all metrics at once, use the Clear All Task Metrics command from the Command Palette (
workspaceTasks.metrics.clearAll) - Switch back to the History tab at any time
Metrics Storage
Metrics are persisted across VS Code sessions. The storage location is controlled by the workspaceTasks.metrics.scope setting:
| Value | Storage |
|---|---|
workspace (default) | Per-workspace (workspaceState) |
global | Global across all workspaces (globalState) |
both | Written to both; workspace takes precedence on read |
disabled | Metrics collection is turned off entirely |
See the Metrics Configuration page for all available settings.
Dashboard Tab
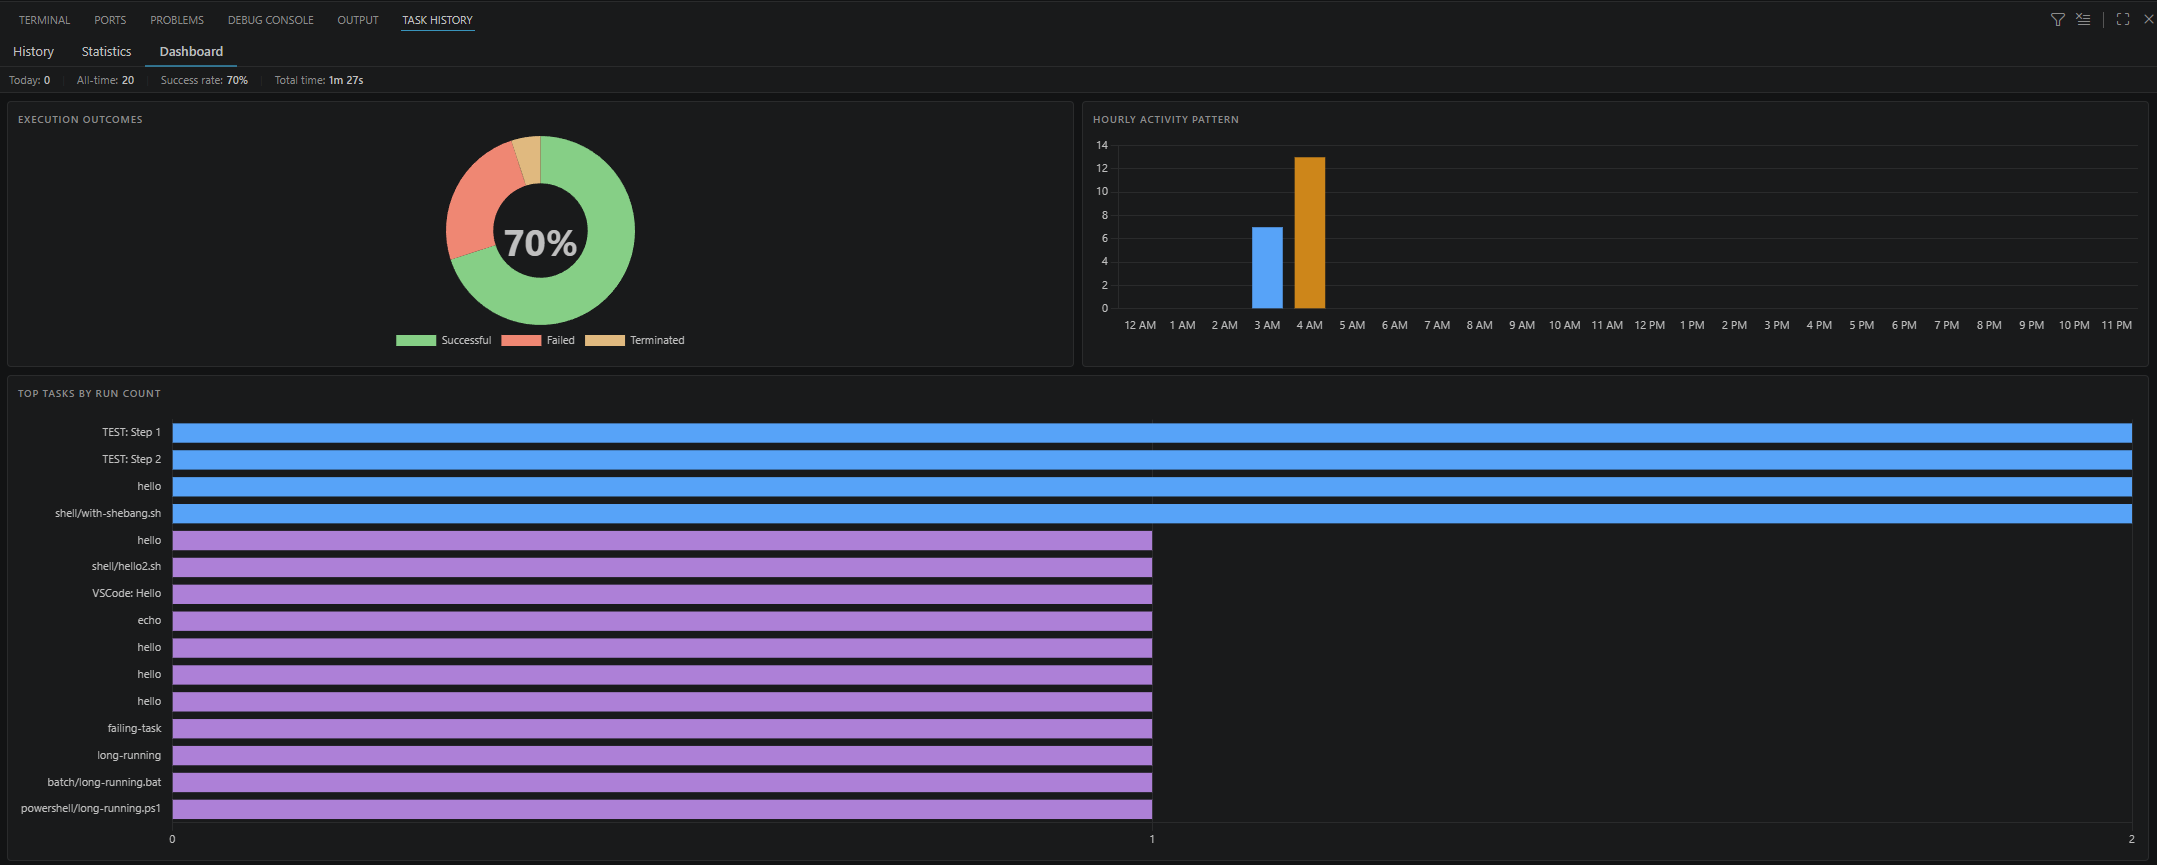
v1.7.0 Task Dashboard — aggregated workspace-wide view of task execution health with interactive charts.
The Dashboard tab provides an at-a-glance, workspace-wide view of task execution health using interactive charts powered by Chart.js. All charts automatically adapt to your active VS Code color theme.
Charts
| Chart | Type | What it shows |
|---|---|---|
| Execution Outcomes | Doughnut | Workspace-wide split of successful, failed, and terminated executions with a centre success-rate label |
| Hourly Activity Pattern | Bar | Which hour of day sees the most task executions — peak hour highlighted in orange |
| Top Tasks by Run Count | Horizontal bar | Up to 15 most-executed tasks, sorted descending |
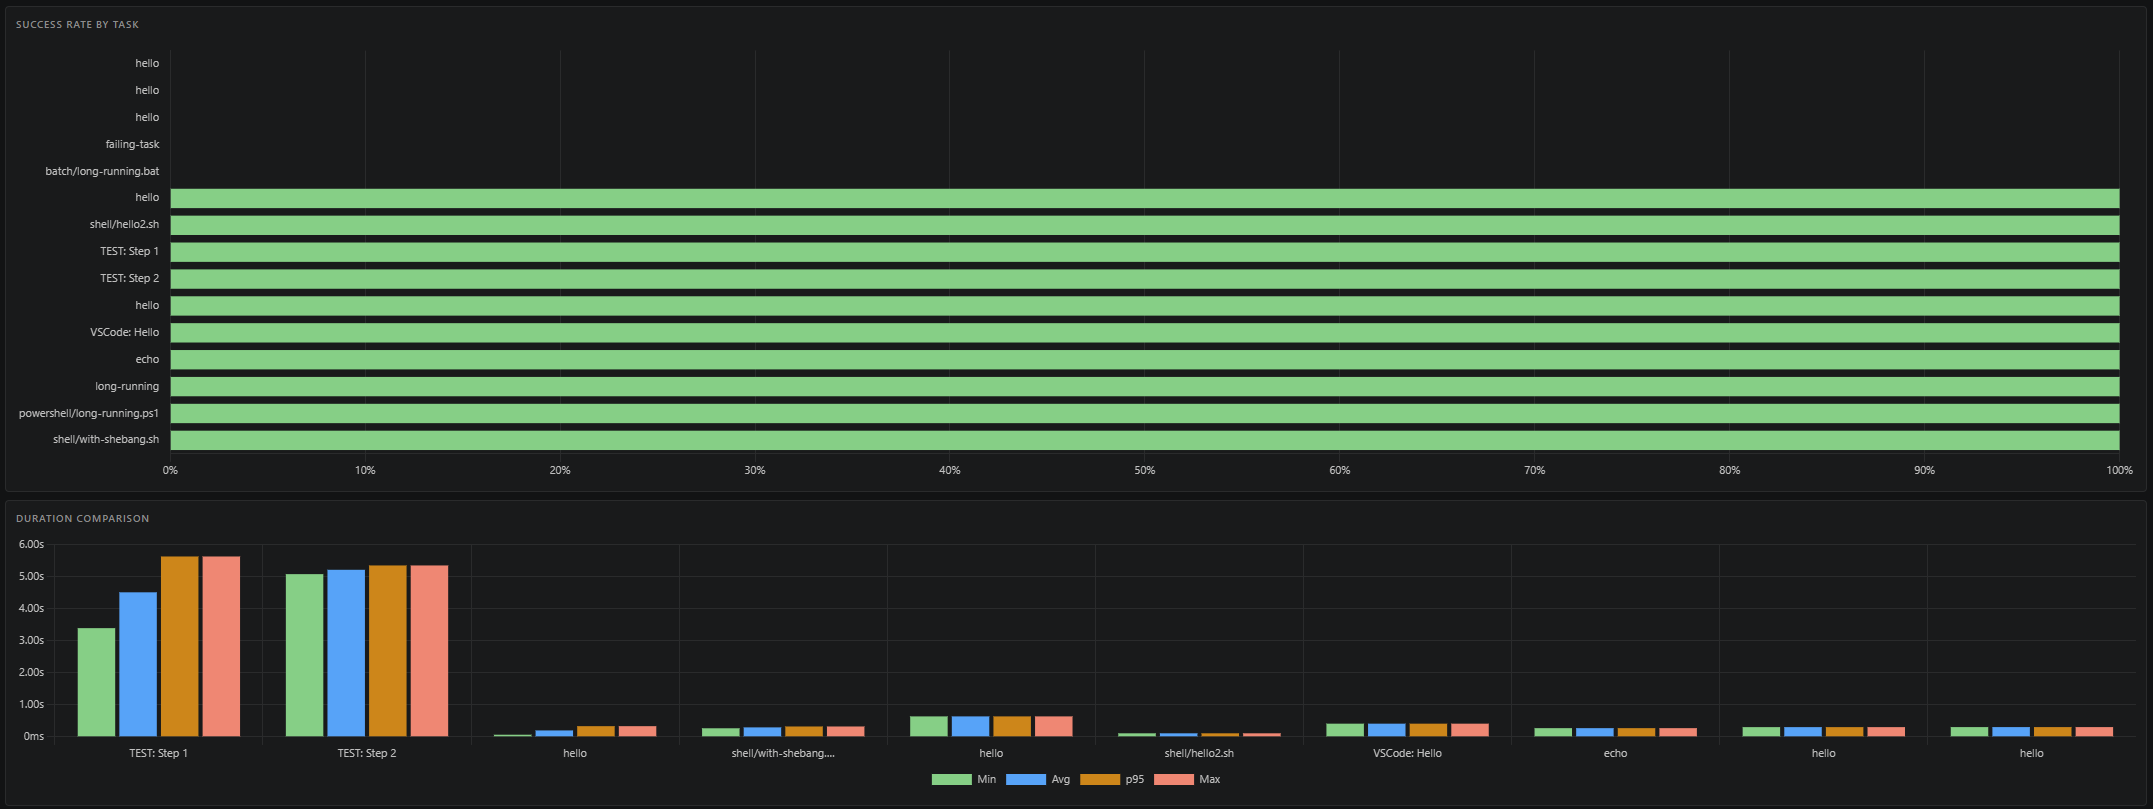
| Success Rate by Task | Horizontal bar | All tasks ranked worst-to-best; bars colored red < 50%, amber 50–79%, green ≥ 80% |
| Duration Comparison | Grouped bar | Min / Avg / p95 / Max durations for the top 10 tasks by execution count |
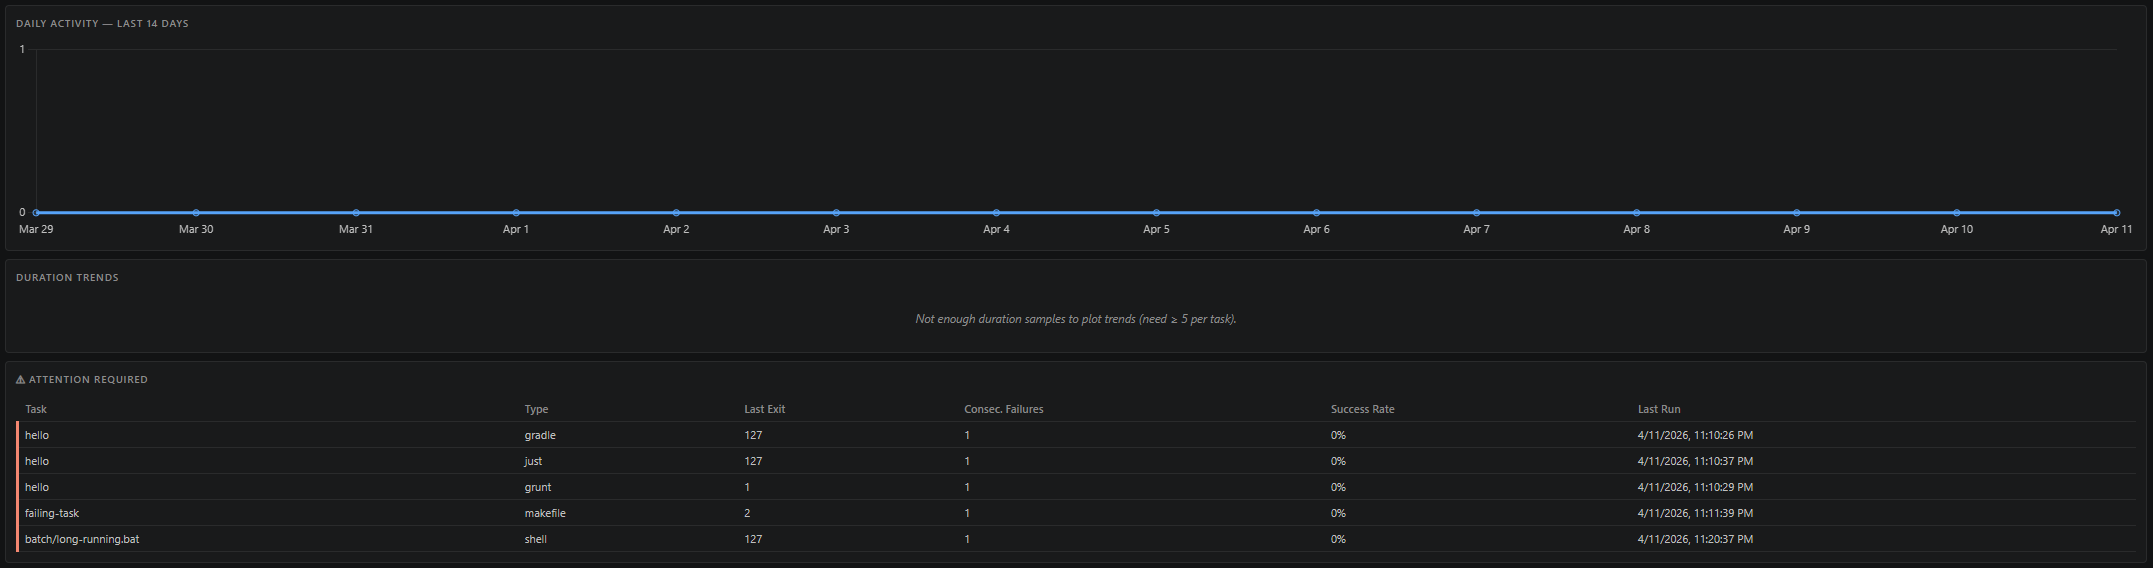
| Daily Activity — Last 14 Days | Line | Execution count per calendar day for the past two weeks |
| Duration Trend Sparklines | Micro line charts | Per-task duration trend over the last N runs; green = getting faster, red = getting slower |
| Attention Required | Table | Tasks that are flaky (≥ 3 consecutive failures), have a success rate below 50%, or failed within the last 24 hours |
Features
- Theme-aware — Charts re-render automatically when you switch VS Code color themes
- Empty state — A friendly placeholder is shown when no metrics have been collected yet
- Atomic data — The dashboard always reflects a consistent metrics + history snapshot from the same point in time
- Persistent tab selection — The active tab (History / Statistics / Dashboard) is remembered across webview recreations
How to Use
- Open the Task History panel
- Click the Dashboard tab at the top
- Charts populate automatically from your collected metrics
- Switch VS Code themes — charts update immediately to match
- Run tasks to see counts, durations, and trends grow over time
The Dashboard requires at least one completed task execution before any charts are shown. Sparklines require a minimum of 5 duration samples per task.
Perfect For
- Debugging task failures by reviewing exit codes and execution times
- Monitoring build and deployment pipeline status
- Tracking task performance over time with duration trends
- Identifying flaky tasks (consecutive failures) at a glance
- Auditing task executions in CI/CD workflows
Next Steps
- Compound Tasks — Run sequences of tasks
- Configuration — Full settings reference
- Metrics Configuration — Configure metrics scope, sample size, and retention
Persistence
v1.9.0 Task History is now persisted across VS Code restarts.
Task History now survives VS Code restarts. Every time a task reaches a terminal state (Success, Failed, or Terminated), the execution record is saved to two storage locations:
.vscode/task-history.ndjson— A newline-delimited JSON (NDJSON) file in the first workspace folder. This is the authoritative archive of all recorded executions and is readable by external tooling.- VS Code
workspaceState— A fast in-memory cache of the most recent records, used to populate the History tab without any file I/O on every open.
On extension activation, the NDJSON file is loaded and the History tab is populated immediately with all previously recorded executions. If the NDJSON file is absent, the workspace state cache is used as a fallback.
Configuration
Two settings control persistence behavior:
| Setting | Default | Description |
|---|---|---|
workspaceTasks.history.maxPersistedRecords | 200 | Maximum number of records stored in the workspace state cache (range 10–2000). The NDJSON archive is not subject to this cap. |
workspaceTasks.history.retentionDays | 0 (unlimited) | Records older than this many days are pruned from both stores on activation. Set to 0 to keep history indefinitely. |
Recommended .gitignore entry
The NDJSON file contains local execution history and should not be committed to source control. Add the following line to your .gitignore:
.vscode/task-history.ndjson
Multi-root workspaces
In multi-root workspaces, all records are stored in a single shared NDJSON file under the first workspace folder (.vscode/task-history.ndjson). Each record carries a scope field that identifies which workspace folder it belongs to, so the data remains correct across all folders.